Without salary caps and league parity, MLB is the professional sport most closely resembling a free market where, in theory, you get what you pay for. But can money buy a winning ball club?
July 9, 2019
Photo by Shutterstock.comPhoto by Alex Kravtsov/Shutterstock.com
It’s that time of year again: Major League Baseball’s All-Star break, a time when investors trade their quote screens for sunscreen, abandon their order books for bestsellers and leave their mobile phones charging on their bedside tables. The All-Star break is also a time when I ask the eternal question: Can money buy a winning ball club? Without salary caps and league parity, Major League Baseball (MLB) is the professional sport most closely resembling a free market where, in theory, you get what you pay for. Of course, in reality that’s rarely the case–and that’s why we love writing about it.
Major League Baseball took a few innovative steps this year in an effort to gin up interest in America’s national pastime and speed up what is perceived, particularly by young people, to be a slow-moving experience. Starting this season commercial breaks between innings were reduced from 2:05 to 2:00 in local games and from 2:25 to 2:00 in national games. Mound visits, those time-consuming conferences between coaches, players and pitchers, were reduced from six to five. The pitch clock–the 30-second timer between batters and the 20-second timer between pitches–introduced last year was not implemented this season due to player protests. MLB outreach extended to Wembley Stadium in London, which hosted the first-ever regular-season games played across the Pond, a two-game series between the Yankees and the Red Sox. Despite MLB’s best efforts at speeding up the game, however, the 17-13 slugfest at Wembley on June 29 lasted 4 hours and 42 minutes–just three minutes shy of the all-time record for a nine-inning game. For the British, that’s a long time spent not knowing what’s going on. In addition to working on speed, MLB will eliminate the waiver trade period, and the July 31 trade deadline will be the only deadline. Players may still be placed and claimed on outright waivers after July 31, but trades will no longer be permitted after that date.
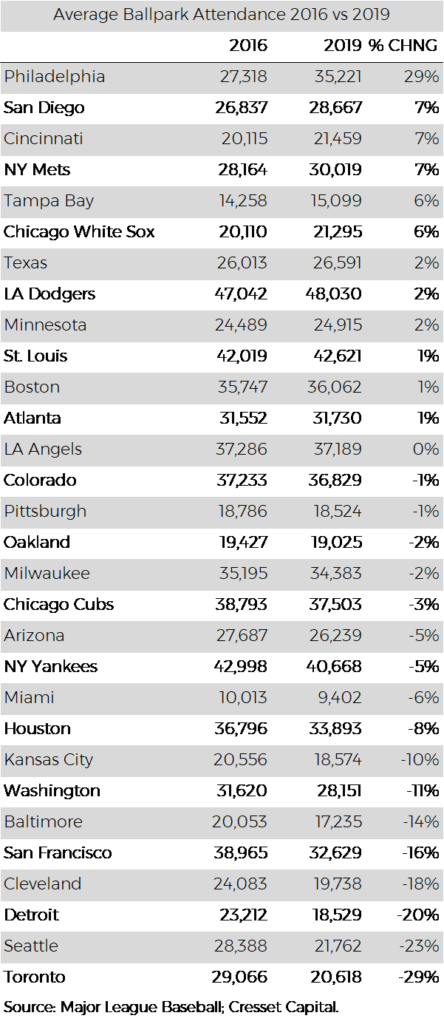
Offense picked up this year. The average batting average is up slightly so far this year, at .251 vs .247 last year at this time. Batters are also hitting more home runs this year: 3,424 vs. 3,283. There have been substantially fewer strikeouts leading up to the 2019 All-Star break, 21,882 vs. 24,537 in 2018. All the excitement should make for greater popularity, right? Unfortunately, baseball has continued to lose fans. Attendance in MLB parks so far this season is down more than 233,000 from the same time frame in 2018, according toUSA Today. In fact, ballpark attendance is lower for the fourth consecutive year, according to theAssociated Press. Eighteen of MLB’s 30 teams are experiencing drops in attendance.
Graphic courtesy of Cresset
American League
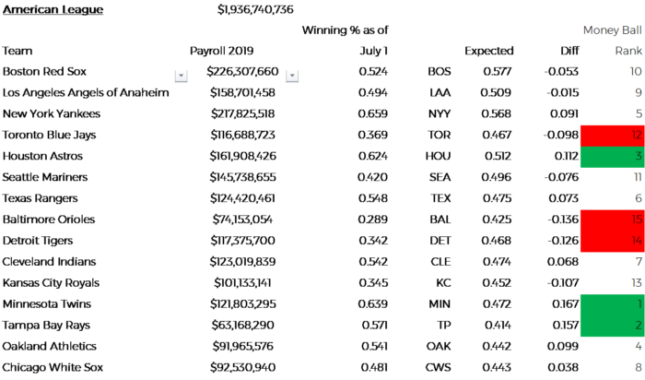
American League (AL) payrolls dipped below the $2 billion mark this year, collectively down nearly $300 million from last year. Thirteen of the AL’s 16 teams trimmed their payroll expenses, perhaps reflecting the pullback in popularity. The Baltimore Orioles suffered the most belt tightening, slashing their payroll by more than $78 million, representing a 51 percent reduction in salaries. The unfortunate Orioles had a .289 winning percentage last year at this time. The New York Yankees, locked into an “arms” race with their red-stockinged rival, increased their payroll by $42 million.
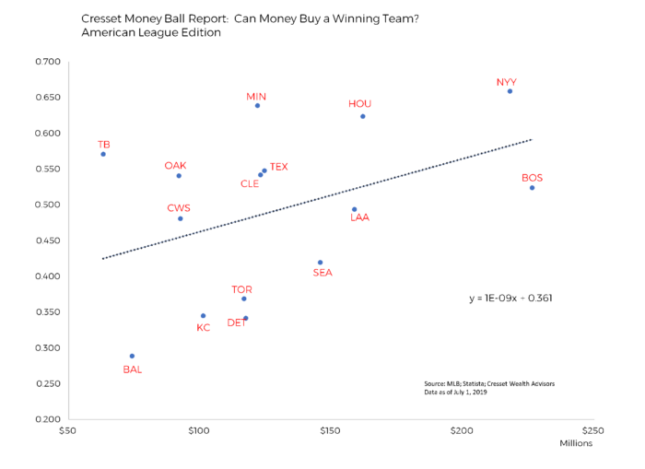
Our Moneyball regression model is upwardly sloping, suggesting that winning percentage and payrolls are positively linked. We estimate that for American League teams, each million dollars spent is worth 1.1 additional wins over the entire season.
Graphic courtesy of Cresset
Winners
Minnesota Twins For a small-market team, the Twins are punching above their weight this year. They are sporting a .639 winning percentage, second in the league behind the New York Yankees. The difference is, Minnesota is carrying a payroll nearly $100 million lighter than their mega-market counterpart. The Twin’s offense is powerful. The team holds the highest batting average in the game this year at .270. They have also hit 157 home runs, the most in the AL. Their slugging percentage–the total number of bases a player records per at-bat–is a mind-numbing .496. While the team leads with offense, pitcher José Berríos is the real deal: He’s ranked 10thin Major League Baseball with a 2.89 ERA. Short stop Jorge Polanco is leading the team with 105 hits.
Tampa Bay Rays
The Rays slashed their payroll by 27 percent and their winning percentage has jumped from .500 to .571. Tampa leads the AL in earned runs with a stingy 3.20. Credit Charlie Morton who, at the age of 35, will be making his second consecutive appearance in the All-Star Game (last year he represented the World Champion Astros). Pitching Ace Blake Snell, coming off last year’s Cy Young Award, is 5-7 this year. Left fielder Tommy Pham leads the team with a .452 on-base percentage. The Rays struggled in June with a 13-16 record, but their fortunes are expected to improve in the second half of the season.
Houston Astros
The Astros maintained their $160 million payroll, and why not? They had a good record last year with a .636 winning percentage and 103 wins. Houston has a strong pitching staff with a league-leading .218 “batting average against.” They are third in the league with a combined 53 wins. Pitching ace Gerrit Cole has 161 strikeouts and 8 wins so far this season. He will be representing the Astros at the 2019 All-Star game, his second consecutive appearance for the team. We can’t forget Justin Verlander, who’s currently holding a 10-3 record and will also be representing the Astros in Cleveland. Houston has a strong offense as well, holding highly ranked team positions in batting average (.267) and home runs (133). All-star third baseman Alex Bregman leads the team with 22 home runs.
Graphic courtesy of Cresset
Losers
Toronto Blue Jays
The Blue Jays are arguably in the toughest division, in which the Yankees and Red Sox combined are spending over $440 million on talent. That said, the team appears to have folded their tent: They slashed their payroll by $57 million after winning only 73 games last year. Despite the salary drop off, the team is underperforming even its diminished expectations: At .369, Toronto is about 8 wins behind what our Moneyball model predicts. The Blue Jays rank near the bottom in hitting and pitching with a team batting average of .232 and earned run average of 4.89. The team will be sending pitcher Marcus Stroman to the All-Star game.
Detroit Tigers
The hapless Detroit Tigers lost nearly 100 games last year with a $146 million payroll, so Al Avila, the Tiger’s executive VP of baseball operations and general manager, must have figured the team could deliver uninspired performance on a beer budget. If that was indeed the game plan, the Tigers succeeded. The team has a .342 winning percentage and, despite the lower payroll, they’re still delivering about 11 wins less than expected. The frustration is personified by team coach Ron Gardenhire’s record-setting seventh ejection this season–the most ejections of a Tigers manager in a single season. Gardenhire is approaching the record of ten ejections in one season, a dubious achievement not reached since 1910.
Baltimore Orioles
Baltimore was bad last year and there appears to be no improvement in sight. The Orioles lost 115 games in 2018, more than twice as many as they won. Expectations for this year were even lower since the team cut their payroll in half. Unfortunately, the team’s $74 million payroll, besting only the Tampa Bay Rays, still didn’t improve their standing on our Moneyball model. At a mere .289 winning percentage, Baltimore is trailing our model’s estimate by 11 wins. The Orioles possess an unheard ofnegative170 run differential; head to head, their opponents have scored 170 more runs than the O’s have produced this year. The only silver lining: at 24 wins, the lackluster Orioles are on pace to outperform last year’s dismal record.
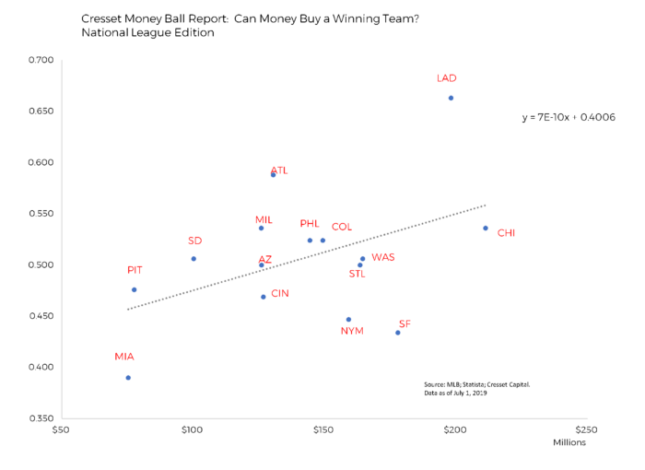
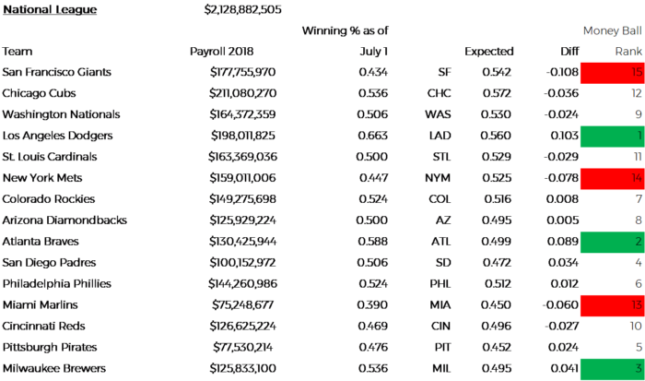
National League
The relationship between winning percentage and payrolls is positive in the National League (NL), suggesting that dollars do drive wins. Team success is slightly more diffuse this year with the LA Dodgers on the upside, with a .663 winning percentage, and the Miami Marlins to the downside, with a pallid .390 percentage. That said, the Dodgers have the second-highest payroll in the league behind the Cubs, and the Marlins have the skimpiest.
Graphic courtesy of Cresset
Winners
Los Angeles Dodgers
LA is a big market team with an equivalently sized payroll: At $198 million, they are ranked second behind the bulge-bracket Chicago Cubs. The team is delivering despite our outsized expectations. The Dodgers possess an enviable .663 record and have delivered nearly nine more wins than expected. The team leads the National League in on-base percentage (.347) and is fourth in home runs and runs batted in. Last year’s World Series runner-up also dominates pitching with a league-leading 57 wins. Fans expect the Dodgers to shuffle their bullpen and potentially move closer Kenley Jansen to mid-relief. There’s speculation that general manager Andrew Friedman will deal for a marquis closer. The Dodgers’ prospects for the rest of the season are strong.
Atlanta Braves
The Braves are one of the few teams that increased their payroll this year. Atlanta won their division in 2018 with 90 wins and are on track to deliver similar success in 2019. At .588, the team has delivered eight wins above our expectations. The Braves will be sending two starters to the NL All-Star team, Freddie Freeman at first and Ronald Acuña Jr. at center field. They will also send starting pitcher Mike Soroka, who at the age of 21 will be the youngest pitcher ever to represent the Braves at the All-Star game. That distinction was previously held since 1989 by 22-year-old John Smoltz.
Milwaukee Brewers
Here we go again . . . the Brewers are the perennial darlings of Cresset’s Moneyball Study and this year is no different. The Brew Crew bumped up their payroll by $27 million and are punching above their weight class this year, with a .536 winning percentage equal to that of the Cubs. The only difference is their payroll is nearly $86 million smaller. Their penury is paying off: The team has delivered nearly 4 more wins than their payroll would suggest. Milwaukee is delivering on all fronts. Christian Yelich is on fire. The Brewers’ All-Star logged his 1,000thhit recently, has clobbered a league-leading 30 home runs, dominates in slugging at .711 and has an incredible on-base percentage of 1.139. Christian will be joined by second baseman Mike Moustakas and pitcher Josh Hader at the All-Star game in Cleveland.
Miami Marlins
The Miami Marlins are struggling, and it appears that Jeter & Co. have thrown in the towel. The team, after losing 98 games last year, slashed their payroll by $30 million. The Marlins trail the majors with the fewest number of home runs, just 64. That’s 21 fewer long balls than Christian Yelich of the Brewers, Pete Alonso of the Mets and Cody Bellinger of the Dodgers have hit collectively this year. Expect Miami to lighten up even further, as the team looks to trade second baseman Starlin Castro at the deadline and find deals for Sergio Romo, Martín Prado, and Curtis Granderson. That echo at Miami Stadium is not an illusion–the team has the lowest average attendance in baseball at 9,402 per game.
New York Mets
Here’s a big market team with a medium-sized payroll. The Metropolitans won 77 games last year and they’re on track to deliver a similarly dismal result this year. At .447, New York is about seven wins below what their payroll would suggest. The team currently leads the NL in blown saves, and its relievers have MLB’s third-highest ERA. The Mets recently fired both their pitching coach and their bullpen coach. First baseman Pete Alonso is a bright spot on offense with 28 home runs. Ace starting pitcher Noah Syndergaard, aka “Thor,” with a 5-4 record, has been battling a strained hamstring but was just reactivated and will go to Cleveland for the Mets.
San Francisco Giants
The Giants are a good team in a bad team’s clothing. San Francisco posted only 73 wins last year and are on pace for a repeat performance in 2019. The team’s run differential isnegative78, second only to the lackluster Marlins in the National League. AT&T Field is not a hospitable place, either: The team’s 18-25 record at home is worse than their 19-22 record on the road. The Giants’ team batting average is .228, barely above the Mendoza line. Needless to say, their on-base percentage, at .295, isn’t much better. On the bright side, Giants closer Will Smith is a perfect 21-21 in save opportunities. He will be making his debut on the NL All-Star team this year.
Since 2020, consumers have become more conscious of their values, time, and social networks—demanding empathetic and human-centered business transformations.